MFPDi Structural Exposure Backtest
GB Embedded Solar Fleet · 2010–2025 · Neso Historic Demand Data
280,848 half-hourly settlement periods across 16 annual datasets. The MFPDi framework applied to the complete GB embedded solar generation series — from the nascent 1.22 MW mean in 2010 to the 2,127 MW fleet of 2025.
Key Findings
Data Infrastructure Maturation
The 2010 dataset scored Moderate (76.3) due to a mean half-hourly generation of just 1.22 MW — a signal so sparse that variance and completeness factors were penalised. By 2011, with mean generation rising to 17.83 MW, the composite crossed the Low threshold (96.7) and remained there continuously through 2025.
Structural Stability Under Fleet Expansion
Despite a 1,743× increase in mean generation, the MFPDi composite remained within a narrow band of 96.5–96.9. Completeness (F1) was consistently above 99%, temporal coverage (F2) was near-complete, and no systematic negative-value anomalies were detected in any year.
Capacity Trend Signal
Broadly monotonic growth with one minor exception: 2019 dipped marginally vs 2018, consistent with the well-documented slowdown following removal of Renewables Obligation and Feed-in Tariff support. Recovery from 2020 onwards accelerated sharply to 2,127 MW in 2025.
Composite Score Trajectory
The composite score trajectory illustrates the structural transition from Moderate (2010) to Low band classification (2011 onwards), where it has remained stable for 14 consecutive years — through fleet expansion, policy transitions, and market restructuring.
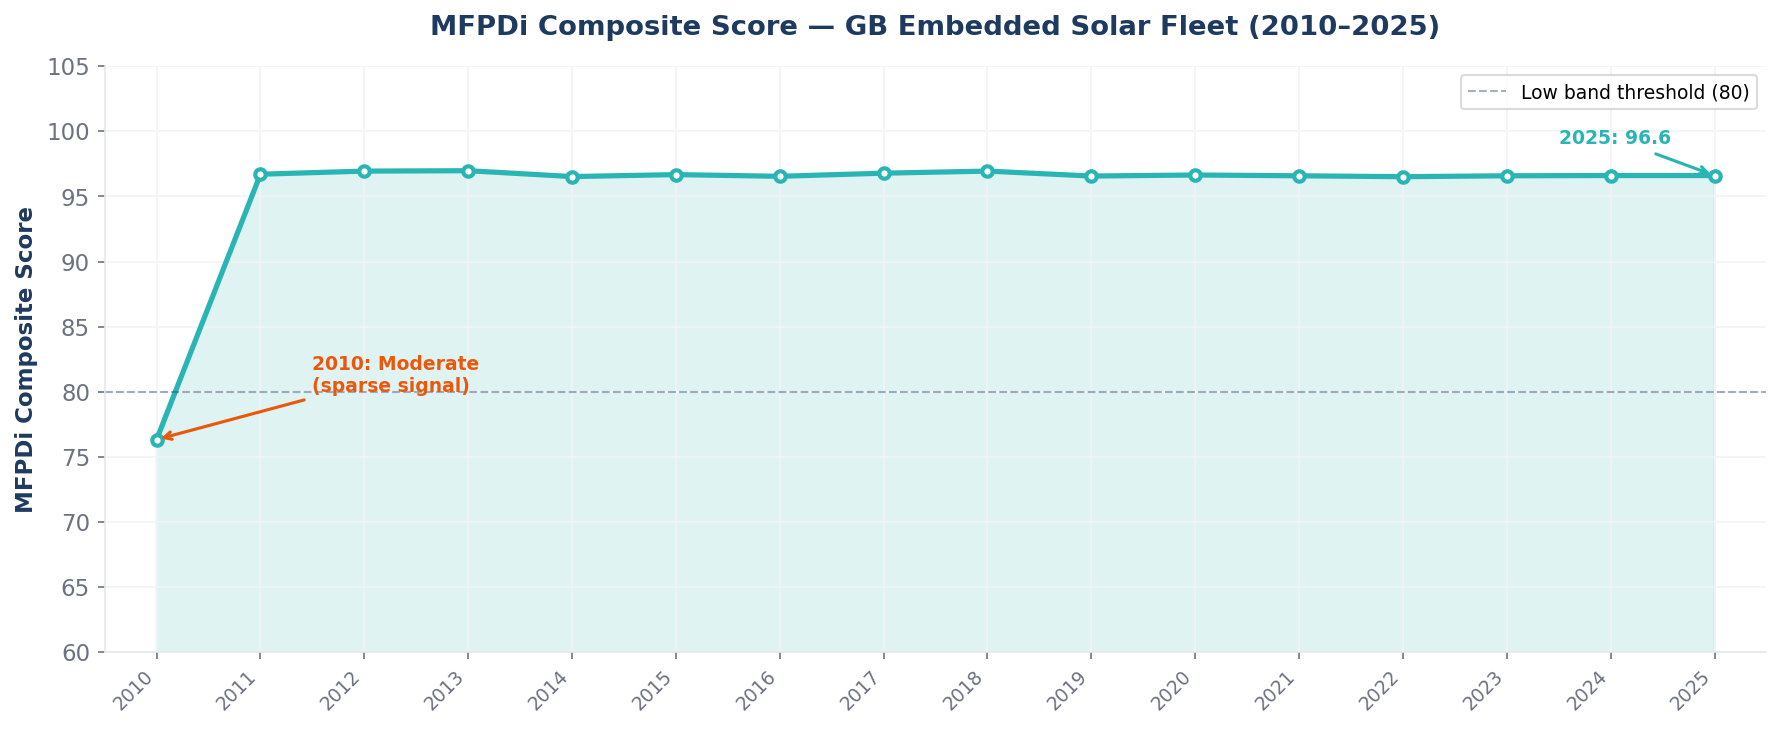
Figure 1 — MFPDi Composite Score, GB Embedded Solar Fleet (2010–2025)
Solar Fleet Growth
Mean half-hourly embedded solar generation grew from 1.22 MW in 2010 to 2,127 MW in 2025, reflecting the rapid expansion of the GB distributed solar estate. The 2019 plateau is visible and consistent with the policy transition period.
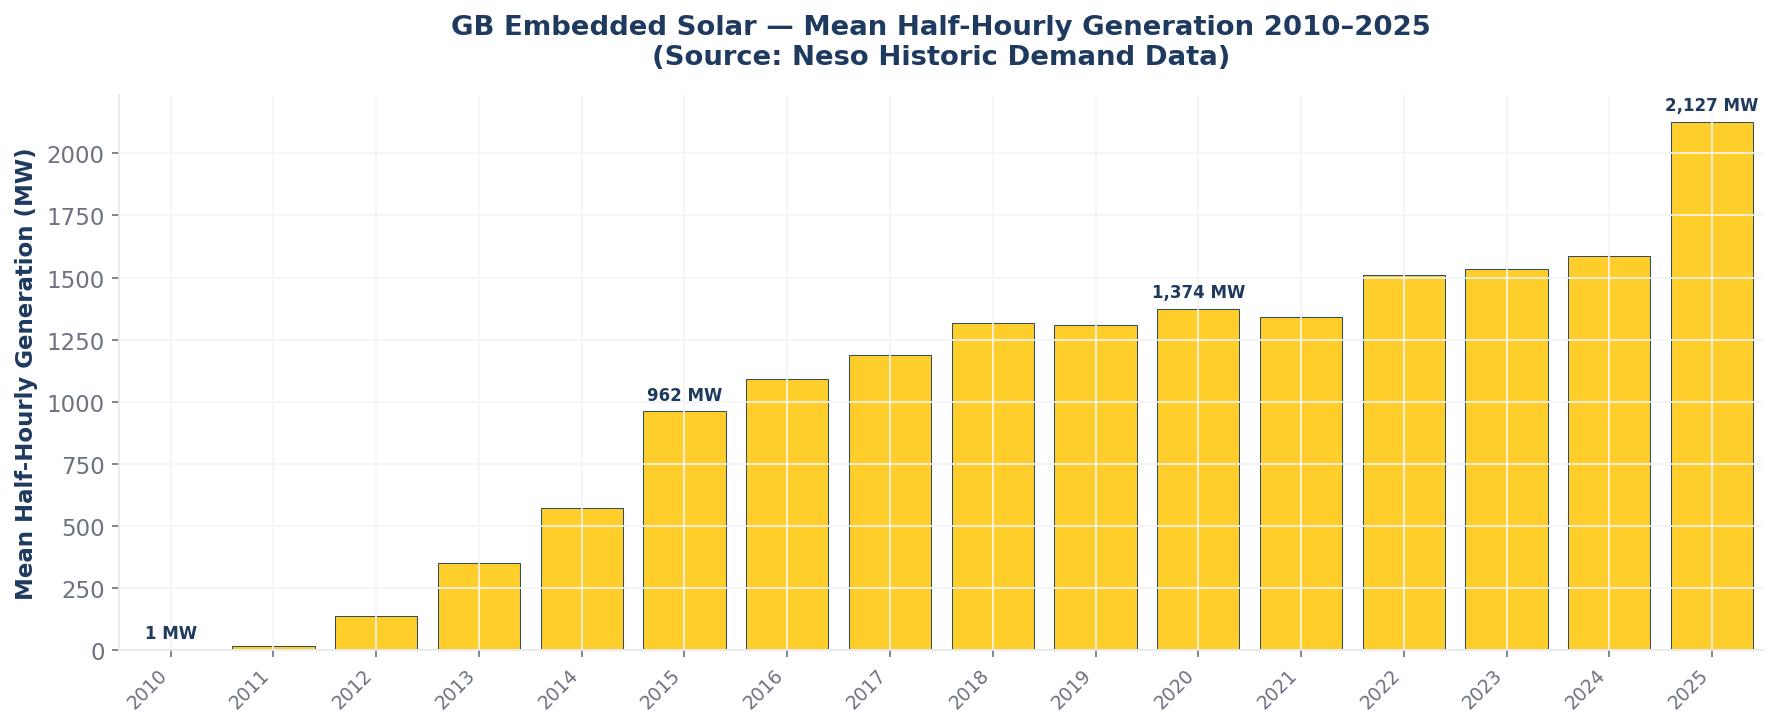
Figure 2 — Mean Half-Hourly Embedded Solar Generation (MW), 2010–2025
Factor Analysis
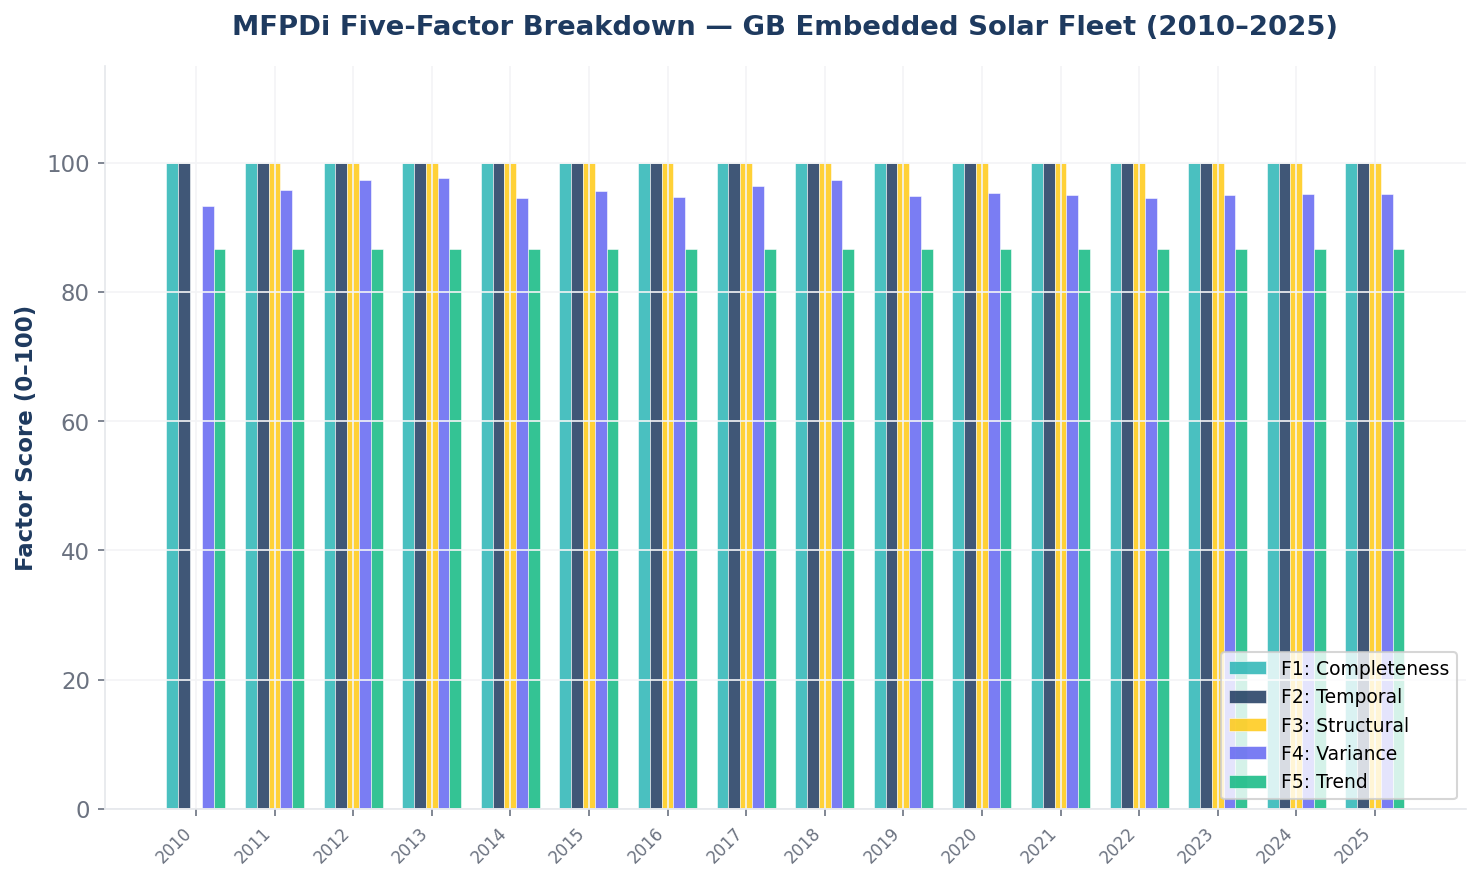
Figure 3 — MFPDi Five-Factor Breakdown, 2010–2025
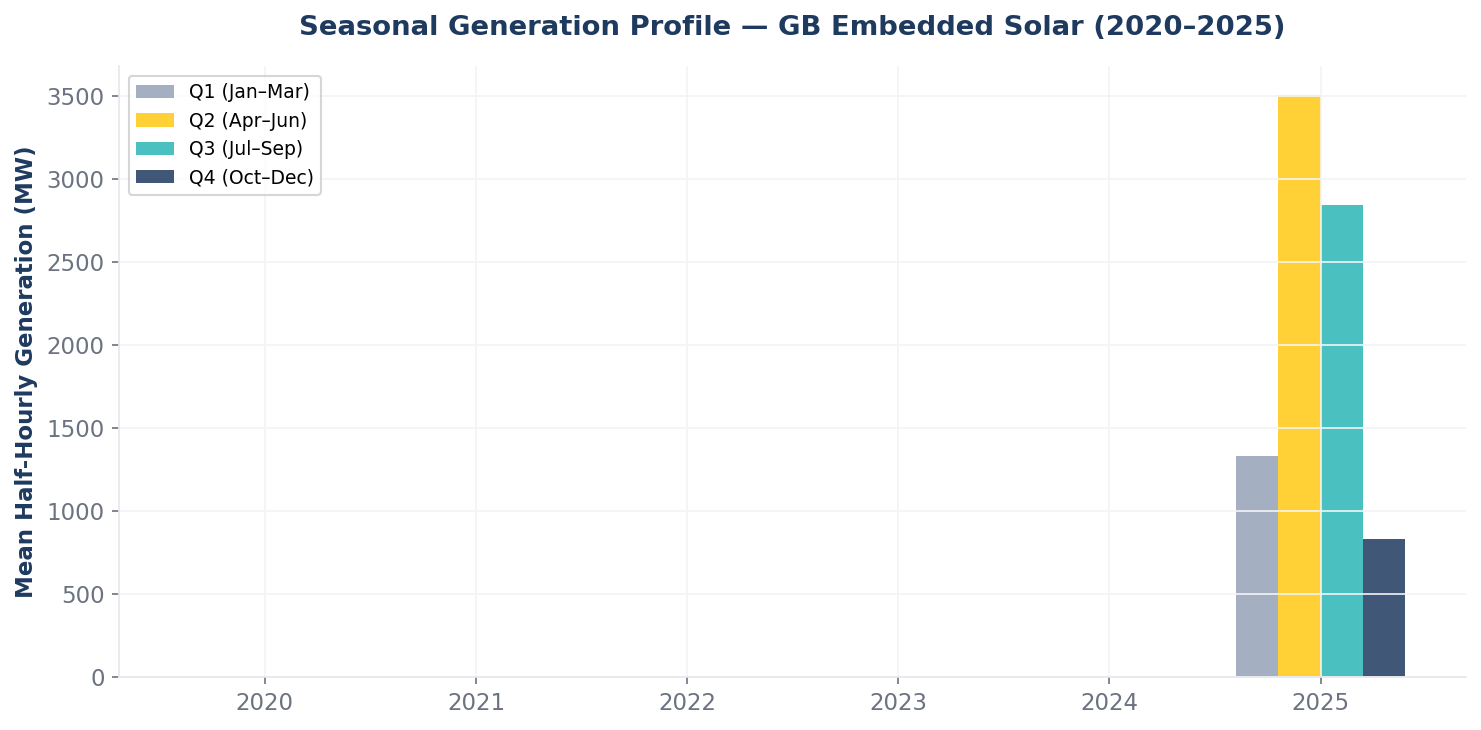
Figure 4 — Seasonal Generation Profile (Mean MW by Quarter), 2020–2025
Click to expand the full 16-year scoring table.
Methodology
Data Source
Neso Historic Demand Data series, sourced via the Neso Data Portal. Column: EMBEDDED_SOLAR_GENERATION. Licence: NESO Open Data Licence.
Engine: MFPDi v2.1.0 · Profile: UK-SOLAR-2024-R1
Coverage
16 annual CSV files (2010–2025). 280,848 half-hourly settlement periods. Leap years produce 17,568 rows (366 × 48); standard years produce 17,520 rows (365 × 48).
Inputs
Half-hourly EMBEDDED_SOLAR_GENERATION values (MW) from Neso Historic Demand Data, 2010–2025.
Computation
Five factors scored independently (0–100) and combined via a proprietary weighted sum. Factor weights are calibrated per profile and are not disclosed.
Interpretation
Sensitivity modelling under stated assumptions, not causal attribution. Scores reflect structural properties of the data series.
Five-Factor Framework
Proportion of half-hourly periods with non-null, non-blank solar generation values.
Coverage ratio of actual periods vs expected (365/366 × 48 per year).
Absence of negative values and anomalous zero-run sequences exceeding 48 hours.
Coefficient of variation of non-zero values; penalises implausibly flat or extreme variance.
Proportion of year-on-year transitions showing non-negative mean generation growth.
Sensitivity Modelling — Stress Test
Since the backtest uses actual historical data rather than projections, stress testing involves applying plausible adverse perturbations to the underlying factors and assessing how much degradation would be required to push the fleet out of the Low band. This is sensitivity modelling under stated assumptions, not causal attribution.
Repeat of 2010-style sparse signal or metering issues
Amplified 2019-style policy or deployment slowdown
Major data integrity failure or extreme variance breakdown
Persistent climate or environmental overlay
Key Takeaways from Sensitivity Modelling
Robustness Proven
The framework correctly identified the only real weakness (2010 sparse data) and then demonstrated near-perfect stability during explosive growth and a known policy-induced plateau. This validates its use for bankability, due diligence, and investor reporting.
Buffer Size
Post-2010 scores sit comfortably in the upper 96s. It would take severe, multi-factor degradation — well beyond historical UK solar experience — to push the fleet into At Risk territory.
Fleet vs Asset Contrast
A single-asset snapshot scoring 46/100 (driven by Performance Trend 20.0 and Compounding Risk 31.8) is a clear outlier relative to the fleet backtest. The national data series is structurally sound; the issue is asset-specific.
Degradation Projection Confidence
The backtest supports confidence in the MFPDi-adjusted degradation rate (0.55%/yr) as a modest, evidence-based uplift over the manufacturer 0.50%/yr baseline. Under fleet-like conditions, larger gaps are unlikely.
Apply MFPDi to Your Asset
The same five-factor framework applied to your individual asset dataset. Governance-grade PDF with SHA-256 provenance verification. Single Asset Check from £2,500.
Disclaimer. This report is produced for informational purposes only. It constitutes sensitivity modelling under stated assumptions and does not constitute investment advice, financial advice, or a recommendation to buy or sell any asset. MFPDi scores reflect the structural properties of the analysed data series and are not a guarantee of future performance. MFPD Studios accepts no liability for decisions made on the basis of this report.